As the conventional optical defect inspection systems use a single or two lasers to
form a measurement region, defects are inspected in a narrow measurement region. In
this study, we fabricated a multidiode optical defect inspection system that used
multiple laser diodes to expand the measurement region. An experiment was conducted
to determine whether the proposed system had a similar performance with respect to
the conventional systems. Specimens were fabricated by simulating the defects of the
pressure piping, which could occur in a nuclear power plant or in industrial sites.
Accordingly, the purpose of the experiment is to examine whether defects could be
inspected during the operation of a piping circulation system. Our results show that
using multiple laser diodes could reduce the cost and secure a wider measurement region,
thereby achieving a cost-effective and high-efficiency defect detection.
Optical defect inspection is particularly beneficial for industrial use, as it can
measure microscopic and structural defects of various materials. This technique can
be applied to the measurement of micro-objects (electronic composite structures, etc.)
in high-technology fields such as aerospace, automobile, and novel materials, which
enables the nondestructive inspection of various machinery and electrical/electronic
products.
As the conventional optical defect inspection systems use a single laser or dual lasers
to form a measurement region, the measurement region for defect detection is narrow.
This study attempted to overcome this disadvantage by applying multiple laser diodes
and controlling the power such that the measurement region could be expanded.
Herein, chapter 2 explains the optical defect inspection system using multiple laser
diodes. Chapter 3 describes the experiment for measuring the defects in the pressure
piping using the proposed optical defect inspection system. Chapter 4 presents the
analysis of the experimental results, and finally chapter 5 presents the discussion.
In shear interferometry, a speckle correlation fringe pattern is formed by connecting
phase points in the degree of the speckle wavelength. The change in the speckle pattern
according to object deformation can be observed in real time by performing a consecutive
cut process for the nondeformed speckle pattern using an image processor [1].
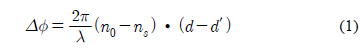
Fig. 1 is a schematic showing the principle of the shear interferometer. The fringe analysis
using the shear interferometer expresses the deformations of two points as the difference
between d and d′, as shown in Eq. (1). Here, the deformations are caused by the shearing amount when
a beam is irradiated on point P. n0 is the irradiation direction and ns is the vector of the observational direction [1].
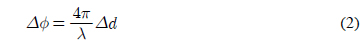
If the angle of beam illumination is perpendicular to the imaging plane, then Eq.
(1) can be expressed as Eq. (2) [1].
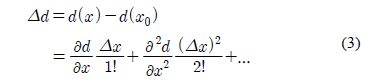
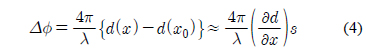
Δd can be expressed by Eq. (3) using the Taylor series. The deformation in the x-direction, Δx is equal to the shearing amount, s on the imaging plane. As this value is small,
terms with two or more degrees can be ignored in Eq. (3). Eq. (2) can be expressed
as the following Eq. (4) [1]:
The light source from a laser was irradiated and diffused on a specimen through the
beam expander. The light reflected from the object surface was divided into two beams
by a beam splitter (BS). These beams entered the charge-coupled device (CCD) camera
again through piezoelectric (PZT) mirror 1 and mirror 2, respectively. At this time,
the light source with changed phase entered PZT mirror 1 and the sheared light source
entered mirror 2. When these two light sources met on the imaging plane, they interfered
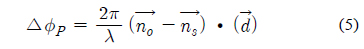
with each other. The phase change due to shearing can be expressed by the following
equations. The phase difference at P is described by Eq. (5) [1].
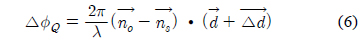
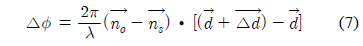
As the interferometer measured the difference in deformation between two points P
and Q, the phase difference Δϕ, where a fringe pattern occurred in the interferometer, was obtained by subtracting
Eq. (6) from Eq. (5), which can be expressed by Eq. (7) [1]:
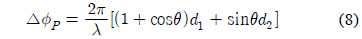
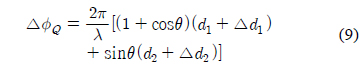
In addition, the phase differences at P and Q between before and after deformation
can be directly calculated, as shown in Eqs. (8) and (9), respectively.
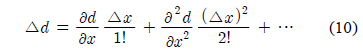
In the equations above (1-7) , and are normal lines to each other. Using Taylor’s theorem, Δd can be developed as follows:
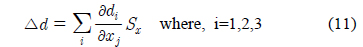
Since Δx is equal to Sx on the imaging plane and this value is very small, Eq. (10) can be expressed as Eq.
(11) [1]:
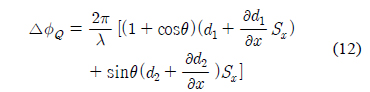
Accordingly, when the values of Δd1 and Δd2 are obtained from Eqs. (1-11) and substituted into Eq. (9), the following Eq. (12)
is derived:
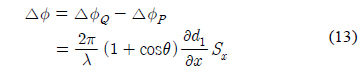
Additionally, if θ is a small value, sin θ is zero. Accordingly, Eq. (13) is obtained.
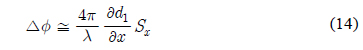
Consequently, Eq. (14) can be derived. As is clear from Eq. (14), the shearography
could directly measure the differential values of the out-of-plane deformation in
the case of a small shearing amount. As the shearing amount ∂x decreases, the function becomes closer to a derivative and the sensitivity (relative
displacement) of an optical system can be adjusted by the shearing amounts. Shearography
or speckle pattern shearing interferometry measures the relative displacement between
two points that are as distant as the shearing amount of the out-of-plane displacement
[1].
In Eq. (14), if the shearing amount shows lim ∂x → 0, the measurement becomes close to the first derivation. The measurements of shearography
are typically expressed as first derivatives. However, any shearography that does
not satisfy the differential condition (lim δx→0) measures the relative displacement between two points not by the first derivatives
but according to the shearing amounts [1].
2.2 System configuration
The multiple diode optical defect inspection system is a noncontact type system using
multiple laser diodes as shown in Fig. 2. This system measures shapes to detect the out-of-plane deformation of defects. As
the system integrates the shearing interferometer-based optical measurement system,
an analysis and image processing program, and a control program, the internal defects
and shapes of pressure vessels and piping can be measured.
As shown in Fig. 3, the proposed system consists of a lens set, a CCD camera, a beam splitter that divides
light, mirror 1 connected to a PZT actuator for precision transport, and the tilting
mirror 2 that applies shearing angles. To use six laser diodes as the light source,
a laser diode arm fixture was designed on the right plate such that the object could
be illuminated with diffused reflection.
Defect inspection system using multiple laser diodes
The conventional single light source diffuses light through an expanding lens. Accordingly,
the measurement region is determined by the diffusion range, which is again based
on the lens curvature, focal length, and material. When the diffusion range increases
within the same distance, the light intensity decreases, which reduces the measurement
region. To solve this problem, the laser power can be increased. However, this solution
increases the cost. As a laser diode is cost effective and has the same specifications,
using multiple number of laser diodes can expand the diffusion range and the light
intensity can also be compensated for the expansion. Consequently, the measurement
region can be effectively increased, as compared to the conventional method.
Two types of specimens for the pressure pipe were fabricated by applying the defect
angle of 90° and arbitrary defects. To model the pressure pipes of a nuclear power
plant, the specimens had the radius of curvature of 250 mm in the circumferential
direction, which corresponded to the tool diameter. The Shape and dimension of piping
test specimens are shown in Table 1.
Shape and dimension of piping specimen
Description
Specimen data
Length of pipe (L)
400 mm
Outside diameter (Do)
76.4 mm
Inside diameter (Di)
69 mm
No Defect thickness (tp)
3.7 mm
The pipe defects in nuclear power plants were reproduced by welding an intact part
and a defective part, which included internal defects under the conditions of Table 2, to fabricate a single pipe specimen. The goal of fabricating the specimens with
such defects was to measure the internal thinning defects that occurred as the complex
effect of erosion and corrosion when the circulation rate increased [7].
Type of pressure vessel specimen
ID No.
Thickness tp (mm)
Width (mm)
Length (mm)
Specimen (1)
01
3/8 tp
2.5
5
02
3/8 tp
2.5
10
03
3/8 tp
5
5
04
3/8 tp
5
10
Specimen (2)
01
3/8 tp
10
5
02
3/8 tp
10
10
03
3/8 tp
20
5
04
3/8 tp
20
10
Specimen (3)
01
4/8 tp
2.5
5
02
4/8 tp
2.5
10
03
4/8 tp
5
5
04
4/8 tp
5
10
Specimen (4)
01
4/8 tp
10
5
02
4/8 tp
10
10
03
4/8 tp
20
5
04
4/8 tp
20
10
Fig. 4 shows the shape and dimension of the specimen. The specimen material is the ASTM
A53 Gr.B type F, its yield strength is 240 MPa, tensile strength is 415 MPa, and its
maximum longitudinal elongation percentage is 30 %. The depth, width, and length of
the defects, which were measured in the experiment, are also presented in each condition.
A modeling system was fabricated to reproduce a defective pressure vessel used in
a nuclear power plant or an industrial plant. Fig. 5 illustrates the modeled image of the pipe circulation system, and Fig. 6 shows the real image of the system.
In the experiment, an enclosed pressure vessel was heated using electric coils and
steam was generated inside the vessel. The generated steam circulated along the internal
pipe and nuclear plant pipes and then returned to the vessel. The maximum pressure
in the pressure vessel was 0.2 MPa, and the highest temperature was 125-130 °C. A
safety device was also installed to maintain the internal pressure of the vessel under
a high temperature and pressure. The system temperature can be controlled by a control
box.
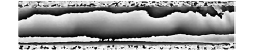
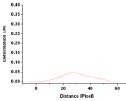
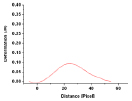
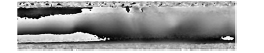
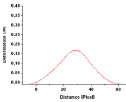
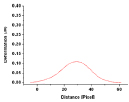
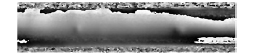
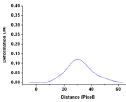
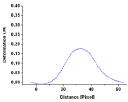
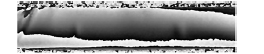
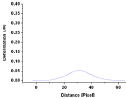
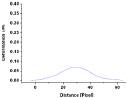
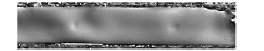
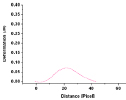
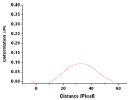
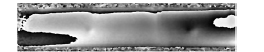
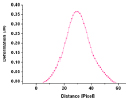
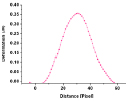
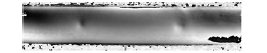
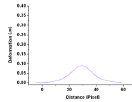
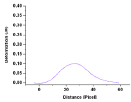
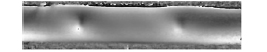
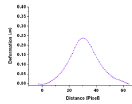
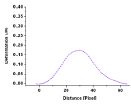
Tables 3 to 6 show the phase maps and line profiles above were obtained using the multiple diodes
optical defect inspection system. The phase maps and line profiles above were obtained
using the multiple diodes optical defect inspection system. The phase maps were based
on variations in the internal temperature of the specimens, and the defect width and
length. The line profiles show the measurements of deformation in the defective parts.
Defect profiles of specimen (1)
No. 01/02
Phase map
Line profile
No. 03/04
Phase map
Line profile
Defect profiles of specimen (2)
No. 01/02
Phase map
Line profile
No. 03/04
Phase map
Line profile
Defect profiles of specimen (3)
No. 01/02
Phase map
Line profile
No. 03/04
Phase map
Line profile
Defect profiles of specimen (4)
No. 01/02
Phase map
Line profile
No. 03/04
Phase map
Line profile
In the experiment, the phase maps of the defects could be identified according to
the temperature variations inside a pressure pipe using the inspection system. We
found that the defects could be measured according to the defect width and length
using the line profiles. The detectable defects ranged from approximately 0.05 μm
to 0.40 μm. The detection results were not significantly different from those obtained
using a single laser; instead, defects could be detected over a wider range.
An optical defect inspection system using multiple laser diodes was used to measure
specimen defects caused by external factors. The internal defects could be measured
with a measurement resolution of 1 μm, and the out-of-plane deformation was measured
with a system resolution of 0.1 μm. The conventional laser interferometers have different
measurement regions depending on the CCD or CMOS specifications and the performance
of the zoom lens. However, this study showed that the measurement region of approximately
200 mm × 100 mm can be obtained using a single laser but the maximum measurement region
of approximately 500 mm × 400 mm can be secured by applying multiple lasers under
the same condition.
If the proposed optical defect inspection system using multiple laser diodes is adopted
in real industrial sites, such cost-effective laser diodes will produce the equivalent
performance to that of expensive lasers, thereby enabling the low-cost and high-efficiency
nondestructive inspection.
Moreover, as the detection range for each measurement is widened, the measurement
duration is expected to be reduced. Consequently, the proposed inspection system will
be particularly beneficial for large-scale plants, wind power stations, aerospace
materials, and any other fields demanding nondestructive inspections of a wide area.
W. Steinchen and L. Yang, "Digital shearography: theory and application of digital
speckle pattern shearing interferometry," Vol. 93, SPIE Press, Washington, USA (2003)
[2]
J.-O. Lee, W.-H. Yoon, T.-H. Lee and J.-K. Lee, "Pre-service acoustic emission testing
for metal pressure vessel," Journal of the Korean Society for Nondestructive Testing,
Vol. 23, No. 3, pp. 280-284 (2003)
[3]
B.-S. Yoon, Y.-S. Kim, H.-J. Lee and Y.-H. Lee, "A study on TOFD inspection using
phased array ultrasonic technique," Journal of the Korean Society for Nondestructive
Testing, Vol. 25, No. 4, pp. 304-310 (2005)
[4]
I. K. Park, "Non-destructive Testing introduction," Node Media, Seoul, pp. 24-25 (2012)
[5]
J. N. Butters and J. A. Leendertz, "Speckle pattern and holographic techniques in
engineering metrology," Optics & Laser Technology, Vol. 3, pp. 26-30 (1971) [CrossRef]
[6]
Y. Y. Hung, R. E. Rowlands and I. M. Daniel, "Speckle-shearing interferometric technique:
A full-field strain gauge," Applied Optics, Vol. 14, Issue 3, pp. 618-622 (1975) [CrossRef]
[7]
K.-S. Kim, S.-W. Seon, T.-H. Choi, C.-G. Kang, M.-G. Na and H.-C. Jung, "Evaluation
of detectable defect size for inner defect of pressure vessel using laser speckle
shearing interferometry," Journal of the Korean Society for Nondestructive Testing,
Vol. 34, No. 2, pp. 135-140 (2014) [CrossRef]

 , and
, and  are normal lines to each other. Using Taylor’s theorem, Δ