In this paper, an experimental study to investigate the relationship between infrared
reflection and moisture content of wood is presented by using an active infrared technique
developed for non-contact measurement of moisture content (MC). The moisture content
of wood used in heritage structures like ancient temples is important for the preservation
and restoration of cultural assets in terms of safety and cultural study. Active infrared
inspection system that detects near-infrared (NIR) through semiconductor photodiode
using Labview program has been developed to measure the radiance of infrared from
wood surface subject to thermal wave heating by halogen lamp. The change of near infrared
radiance of wood samples composed of domestic pine was identified and linearly related
to the moisture content of wood.
Keywords: Moisture Content, Near Infrared, Heritage Structure, Material Property, Structural Diagnosis.
As the importance of preserving national cultural assets increases with the growth
in the South Korean economy and advances in social and historical consciousness, assessment
of life span and soundness of heritage structures become important. In particular,
one of the most important parameters in wood preservation that has the largest impact
on the structural properties of wood is the moisture content (MC) [1]. Currently, two methods are used to measure the MC: one measuring the electrical
conductance, and the other using a dielectric. These methods essentially insert or
touch a measuring device into or onto the wood. In this study, however, a new technique
and device were developed to measure the MC in a non-contact manner.
Because the measurement of the MC of wood used for heritage structures and cultural
assets must not damage or deform the wood surface owing to their archaeological importance
and preservation, a new non-contact MC measuring technique is required, and a recently
acclaimed infrared (IR) method has been considered one of the most appropriate of
such methods. In this study, a nondestructive measurement system capable of assessing
the MC of wood using an active infrared technique (IRT) with excellent measurement
precision was designed and fabricated.
This study was conducted to confirm whether the active IRT can be used to assess the
MC of wood, and investigated the relationship between the MC and IR reflected intensity
by measuring the latter from the wood surface of domestic pine wood samples, which
are subjected to an external thermal wave for heating purposes.
From a chemical perspective, wood has a layered structure consisting of polymers,
such as cellulose, hemi-cellulose, and lignin. Fig. 1 shows a structure with such chemical components. Because C-O and O-H are combined
with water molecules, the MC is one of the most important components for determining
the physicochemical characteristics of wood. In other words, polymers in wood expand
or shrink, and the strength of the wood varies depending on the change in the MC [1,2].
The moisture in wood exists in two forms: free water and bound water. Free water exists
in the cavities of the wood cells in a liquid or gas state, whereas bound water exists
in the materials of the cell walls. Although the cellulose of the cell walls is highly
hydrophilic as shown in Fig. 2, and thus combined with moisture, free water may easily escape the wood through evaporation
or become absorbed. When trees are first cut, the MC is approximately 50%. When the
wood starts to dry, the free water easily escapes, reducing the amount of moisture.
When such water evaporation is complete, the bound water in the cell walls starts
to escape.
The structure of wood does not change or shrink despite the disappearance of the free
water, but shrinkage or deformation starts to occur when the moisture in the cell
walls evaporates. This critical point is called the fiber saturation point (FSP).
Normal wood reaches the FSP when its MC is between 25 and 30%. Therefore, since because
the MC significantly affects the mechanical properties of the wood, such as the material
properties and tensile strength, the material strength of wood, for example, is known
to gradually increase as the MC decreases to below the FSP.
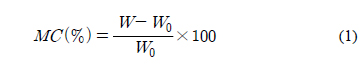
The MC refers to the weight ratio of the moisture contained in the wood to the wood
itself, and can be expressed through the following equation.
where W is the weight of the wood for which the MC is to be obtained, and W0 is the absolute dry weight of the wood sample obtained by drying it at 100-105 ℃.
The MC can be measured using the aforementioned electrical MC measuring device, which
is widely used in the field owing to its simple and easy measurement technique despite
its measurement accuracy being relatively lower than that of an oven drying method.
In an oven drying method, the weight of the sample is first measured, and is then
measured again after drying the sample in an oven at 103 ℃ for 24 h to calculate the
MC using Eq. (1) (KS F2199).
2.2 IR reflection and absorption characteristics of wood
When IR radiation energy is introduced to an object of Fig. 3, some of it is absorbed or reflected, and the rest is absorbed in the material. According
to the energy preservation law, this can be expressed as Eq. (2) below [2].
where ρλ is the reflectivity, αλ is the absorption rate, and τλ is the transmissivity. Because τλ=0 holds for heat radiation on opaque surfaces, such as wood, Eq. (2) can be simplified
into Eq. (3), indicating that the measurement of either the absorption rate or the
reflectivity can reveal the rest for opaque surfaces.
In addition, according to Kirchhoff, when heat radiation is irrelevant to the direction
(diffusion radiation), the relationship between the emissivity (∊λ) and the absorption rate can be expressed through the following Eq. (4). Using this
law and Eq. (3), if one material property (reflectivity or absorption rate) is known
for an opaque surface, the other material properties can be obtained.
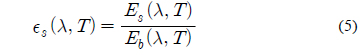
Therefore, if the IR reflectivity is known, the emissivity can be obtained using Eqs.
(3) and (4). The IR emissivity can be calculated using Eq. (5) below after measuring
the radiation energy intensity Eb of a reference sample (e.g., a black body) and the radiation energy intensity Es of the sample to be measured.
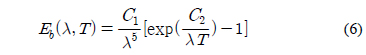
The radiation energy of the reference material can be obtained using Plank's law Eq.
(6) below [2].
where C1 = 3.742 × 10⁸ [W·μm4/m2], and C2 = 1.439 × 10⁴ [μm·K]. However, because a reference material, a precision rotating device, and a
professional measuring device are required to measure the radiation energy, in this
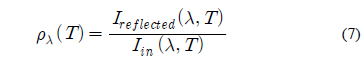
study, the reflectivity (ρλ) is measured instead of the radiation energy of the material. The IR reflectivity
is the ratio of the reflected energy Ireflected(λ,T) to the radiation energy incident on the material Iin(λ,T), and can be expressed as follows as Eq. (7).
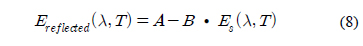
Combining this equation with Eqs. (3), (4), and (5) results in the following linear
relationship between the radiation energy and the reflected energy.
where A=Iin(λ, T) and B=Iin(λ, T)/Eb(λ, T). In Eq. (8), when constant input energy Iin(λ, T) is applied to the material, A and B have constant values because the radiation energy
Eb of a black body is a constant at the same temperature. Therefore, from Eq. (8), it
is found that the reflected energy Ireflected(λ, T) is linearly proportional to the radiation energy Es, and this equation shows that the radiation energy of the material decreases when
its reflected energy increases, and the radiation energy increases when the reflected
energy decreases. Therefore, in this study, the change in the radiation energy Es of a wood sample was investigated in an indirect manner by measuring the reflected
energy Ireflected(λ, T) at a specific angle using only the proportional relationship of Eq. (8) without
obtaining the constant values A and B.
The wood used in this experiment was from a pine tree, which is the most widely used
tree in South Korea. A log was dried outdoors for a certain period, and was cut into
15 rectangular parallelepiped samples with the same dimensions (65 mm (width) × 150
mm (length) × 28 mm (thickness)). The surface of each sample was ground to have the
same surface roughness. The surface roughness of the samples was identified as approximately
52.1±11.7 μm by measuring the Rmax value three times at the center using a surface
roughness measuring device (Surform 1400D, CmiTek) and averaging the results. Fig. 4 shows the fabricated wood samples. Despite the same sizes of the samples, the weights
of the samples were different. This is because each sample has a different MC and
different physical property depending on which part of the log it came from. For these
reasons, the MC was measured at several positions of each sample using a dielectric
MC measuring device used in the field (Fig. 4), and it was found that the MC was different by a few percentages depending on the
position, and the measurement of each sample was slightly different as well.
To dry the wood samples, an oven drier was used, as shown in Fig. 5. The temperature of the oven drier was set to 100-105 ℃ in accordance with the KS
test standards. Because the weight of a sample varies during the drying process, the
weights of each sample before and after drying were measured using a precision scale
(Fig. 5). After the weight of each sample was measured, the samples were dried in a dryer.
The drying process was divided into five or six steps according to the time. For example,
after 0, 6, 12, 18, and 24 h of drying, each sample was exposed to a temperature of
approximately 22 ℃ (humidity of approximately 48 %) at each step, and its MC was measured
by measuring its weight with a precision scale. For an accurate MC measurement, the
weight of each sample must be measured after taking it out of the drier, and again
after drying it for an additional 24 h, and the MC must be calculated from these two
weights [2,3]. However, this takes a large amount of time, and the process is complicated. Therefore,
in this study, the MC of each sample was measured using a dielectric measuring device
at each drying step for the purpose of observing only the relative changes in the
MC.
The experiment setup for an IR reflectivity measurement largely consists of three
components, as shown in Fig. 6. The first is a photodiode for detecting the IR rays radiated from the wood and amplifying
circuit, the second is a halogen lamp that can be remotely controlled through the
Ethernet, and the third is a computer that receives the IR sensor output values in
order to store, monitor, and analyze them.
The near-infrared (NIR) sensor used in the IR measuring device was an InGaAs PIN Photodiode
(Excelitas C30617 model). The distance between the sensor and wood was 100 mm, the
distance between the wood and halogen lamp was 130 mm, and the angle between the IR
sensor and the light source was approximately 60°. A barrier was installed between
the photodiode and the halogen lamp to reduce unnecessary IR reflection, and the sensor
and device were covered with black paint and black paper to insulate them from the
outside.
Fig. 7 shows the IR absorption characteristics of the pine based on frequency. The figure
indicates the IR absorption rate under various drying conditions (drying in an oven
at 180℃ for 0, 2, 4, 6, 12, and 24 h) [3]. In this graph, large absorption rates occur at two frequency bands in common. It
is known that the spectrum near 3,000 nm is mainly caused from the vibration of water
molecules, and the absorption in the 900-1,700 nm band is caused by the absorption
of the water components in the polymer chain structures, such as C-H and H-O, in the
cells. In this study, the IR absorption band (900-1,700 nm) by such polymer chain
structures was investigated, and its relationship with the MC was analyzed.
The wavelength range of the NIR photodiode used in this study was approximately 800
to 1,700 nm. Because the range includes the NIR absorption characteristic band of
the wood shown in Fig. 7, it was possible to sensitively measure the change in NIR characteristics. This sensor
consisted of a single-pixel detector with a radius of 100 μm and a ball lens; in addition,
its angular field of view (AFOV) was 10° and its FOV was 18 mm at a 100 mm distance.
A tungsten halogen lamp (Heraus, 200W) was used to introduce NIR to the wood samples.
As shown in Fig. 8(b), the spectral characteristics of this lamp exhibited a main spectrum band of approximately
600-2,000 nm, confirming that there was no problem in applying the desired NIR area
(900-1,700 nm) to the wood samples for their excitation. The signals measured by the
NIR photodiode sensor were converted into digital input signals using the NI DAQ board,
and the IR reflected intensity of the wood in real time was measured 100 times for
5 s each, and the average value was produced using Labview software. Fig. 9 shows the fabricated measuring device and a scenario in measuring the IR reflectivity
[4,5].
In the experiment, the wood samples were taken out of the oven drier at certain intervals
while being dried, and the IR reflected intensity occurring when the halogen lamp
excited the samples was measured using the developed experiment setup. To increase
the reliability of the measurement results, three samples with the same sizes, similar
weights and MCs of approximately 33% were extracted and dried. There were five drying
steps: at 0, 60, 120, 180, and 240 min. As the drying time was sequentially increased,
each sample was taken out of the oven drier at each step and naturally cooled at a
temperature of approximately 22℃, which is room temperature, and a humidity of 48%
to measure its weight, MC, and IR reflected intensity based on the output voltage
(volt) of the IR sensor. These drying steps were set during the initial four hours
with significant changes in the MC observed through a prior drying test. The measured
NIR reflected energy is the sum of the reflected energy by the halogen lamp and the
radiation energy of the sample itself, although it was assumed that all of the measured
IR energy was the reflected energy by the halogen lamp because the reflected energy
by the high-output halogen lamp used in this study was relatively much higher than
the radiation energy of the sample. This was also confirmed through the results of
the prior experiment. The output of the NIR sensor was very insignificant with regard
to the noise level whereas the halogen lamp was not applied for excitation. The results
are summarized in Table 1 and shown in the graphs of Figs. 10 and 11. Fig. 10 shows the output values (volt) of the NIR photodiode, which represent the IR reflected
intensity according to the drying time; as the moisture content in the wood decreases,
the NIR absorption amount also decreases, which leads to a higher IR reflected intensity.
As indicated in Fig. 11, the MC also showed a tendency to decrease as the drying time increased. From the
results of Figs. 10 and 11, it could be confirmed that MC and IR reflected intensity have an inversely proportional
relationship.
IR reflected intensity and MC according to the drying time
Drying time (min.)
Sample #7
Sample #8
Sample #9
Weight(g)/MC
Reflected intensity (Volt)
Weight(g)/MC
Reflected intensity (Volt)
Weight(g)/MC
Reflected intensity (Volt)
0
173/33%
8.14
174/34%
8.33
173/33%
8.19
60
168/29%
8.28
169/31%
8.42
169/30%
8.36
120
165/26%
8.44
165/30%
8.50
165/27%
8.50
180
161/25%
8.78
160/27%
8.91
161/27%
8.70
240
159/24%
8.81
125/25%
9.18
158/24%
8.97
In general, because the MC of wood does not decrease completely linearly according
to the drying time, it is also hard to state from Figs. 10 and 11 that the IR reflected intensity or MC has a linearly proportional relationship with
the drying time even though they show proportional relationships as a whole. However,
it was experimentally confirmed that the MC of wood has a proportional relationship
with the IR reflected intensity. Therefore, it was found that the MC of wood can be
indirectly assessed using the IR reflected intensity.
The relationship between the moisture content (MC) and the infrared (IR) reflected
intensity of wood was investigated using the near-infrared (NIR) absorption characteristics
of the moisture contained in the wood. Pine wood samples with the same size were fabricated,
and the NIR reflected from each sample was measured using a semiconductor-type InGaAs
photodiode while a halogen lamp with an NIR spectrum was applied to the sample surface.
The experiment results showed that the MC of each sample decreased as the drying time
increased and the moisture decreased, and that the IR reflected intensity increased
as the IR absorption amount decreased at the same time. Therefore, it was confirmed
that MC and IR reflected intensity have an inversely proportional relationship, indicating
that the MC can be assessed if the IR reflected intensity is measured.
Based on the results of this study, it was confirmed that the active IR nondestructive
inspection technique can be effectively utilized for assessing the MC of wood as part
of a structural diagnosis of wood materials for the preservation and restoration of
wooden heritage structures.
J. K. Hwang, "The moisture content and mechanical characteristics of wood," Journal
of Korea Institute for Structural Maintenance and Inspection, Vol. 15, No. 4, pp.
3-6 (2011)
[2]
B. C. Kang, S. M. Kim, J. Y. Choi and G. O. Kim, "a study on infrared emissivity measurement
of material surface by reflection method," Journal of the KSNT, Vol. 30, No. 5, pp.
484-488 (2010)
[3]
B. Esteves, A. Velez Marques, I. Domingos, and H. Pereira, "Chemical changes of heat
treated pine and eucalypt wood monitored by FTIR," Maderas. Ciencia y tecnología,
Vol. 15, No. 2, pp. 245-258 (2013)
[4]
T. Min, H. Na and N. Kim, "Development of LabVIEW program for lock-in infrared thermography,"
Journal of the KSNT, Vol. 31, No. 2, pp. 127-133 (2011)
[5]
S. Yang and N. Kim, "Thermographic inspection of fatigue crack by using contact thermal
resistance," Journal of the KSNT, Vol. 33, No. 2, pp. 187-192 (2013)